 |
Covid-19 Statistic Graphs Data sourced from John Hopkins University & TN.gov web sites |  |
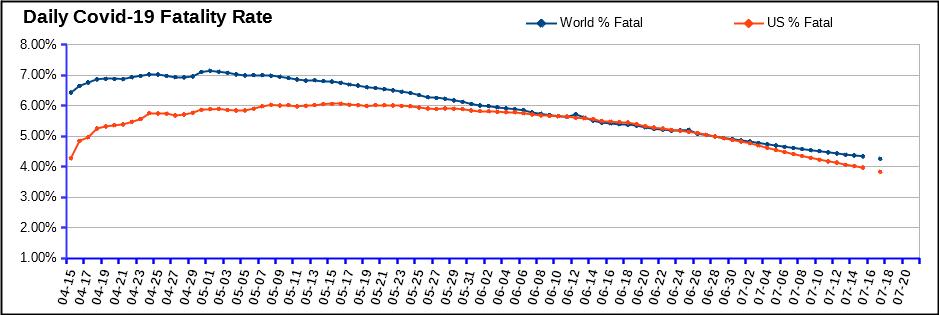 Chart1: Daily reported Covid-19 fatalities as a percentage of reported cases. coronavirus.jhu.edu | |
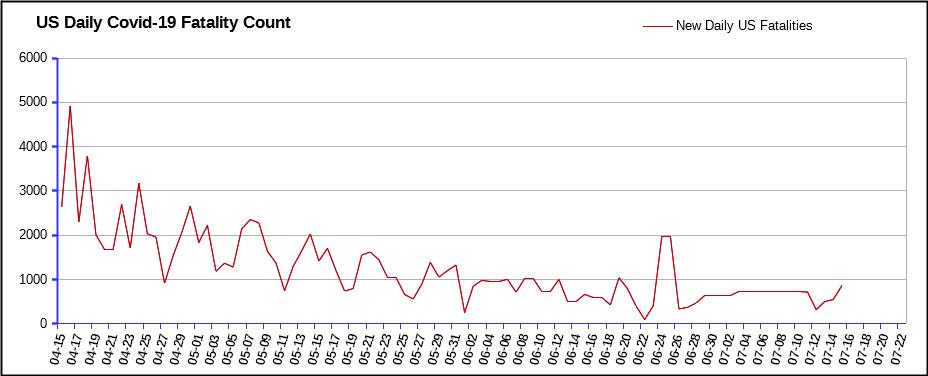 Chart1b: Daily reported change to US Covid-19 fatalities. coronavirus.jhu.edu | |
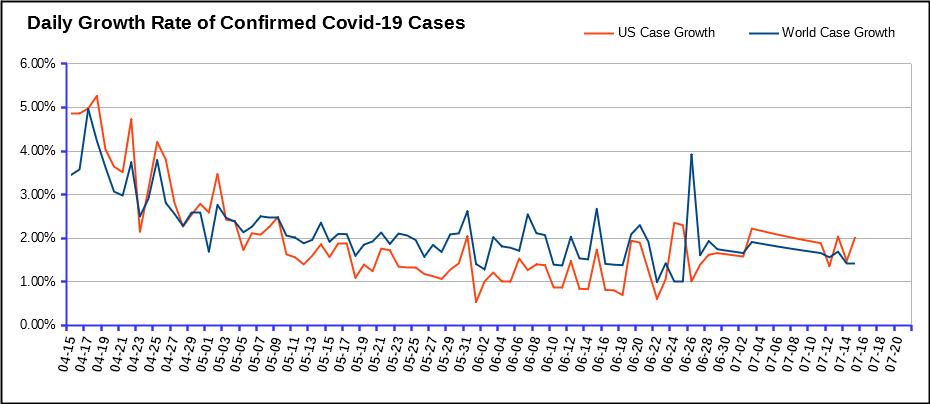 Chart2: Percentage increase/decrease in confirmed Covid-19 related cases. coronavirus.jhu.edu | |
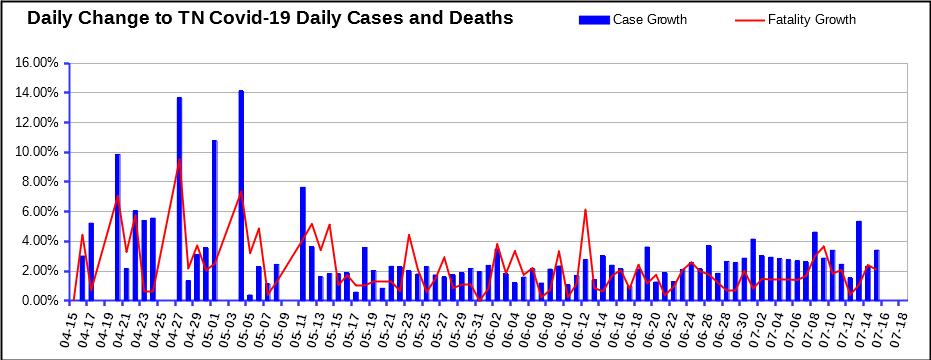 Chart3: Daily change to TN reported Covid-19 cases and fatality counts. www.tn.gov | |
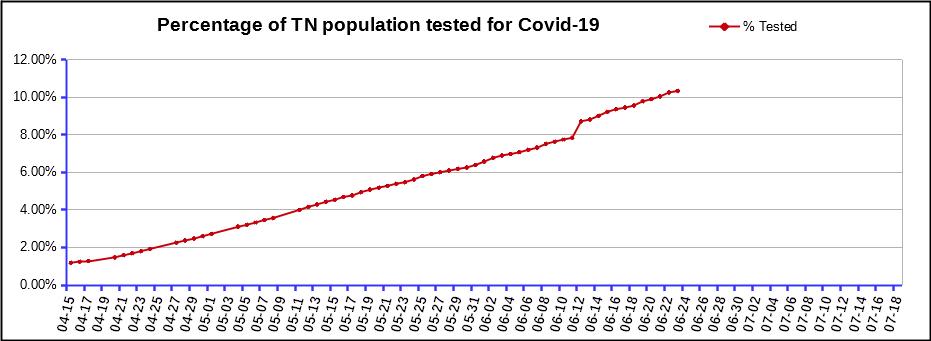 Chart4: Tennessee Covid-19 test progress. www.tn.gov | |
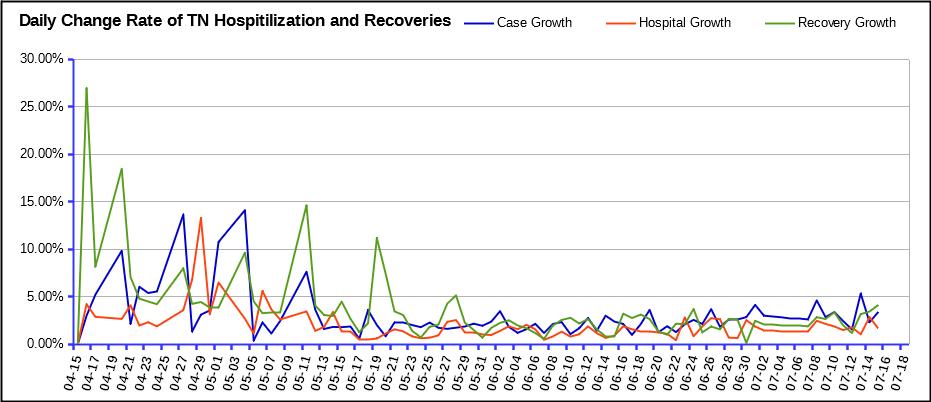 Chart5: Daily change to Tennessee Covid-19 hospitilizations and releases. www.tn.gov | |
 Chart6: Daily count of Tennessee Covid-19 fatalities. www.tn.gov | |
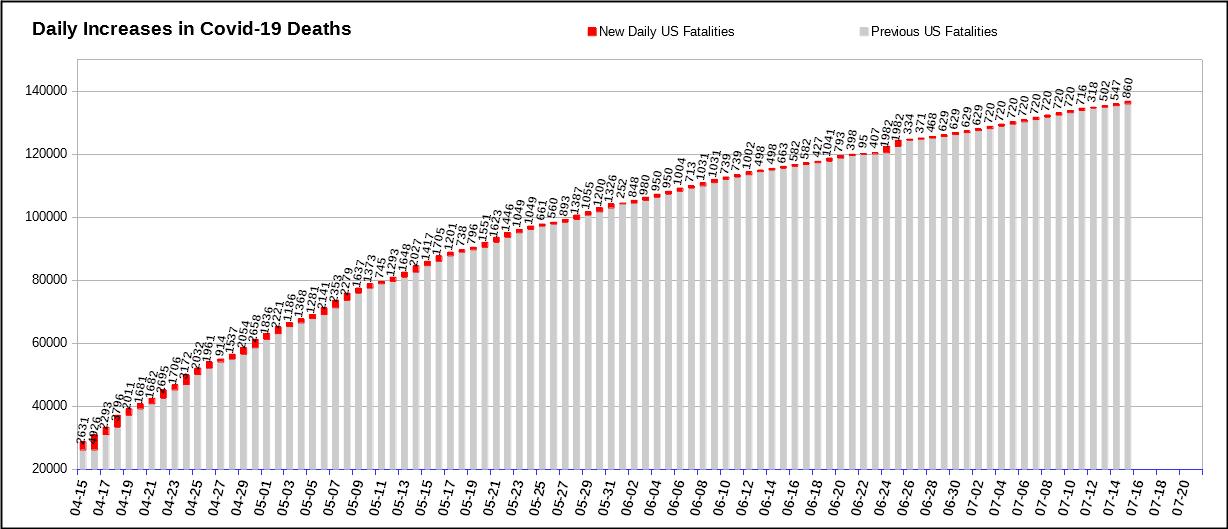 Chart7: Daily reported change to US Covid-19 fatality totals. coronavirus.jhu.edu | |
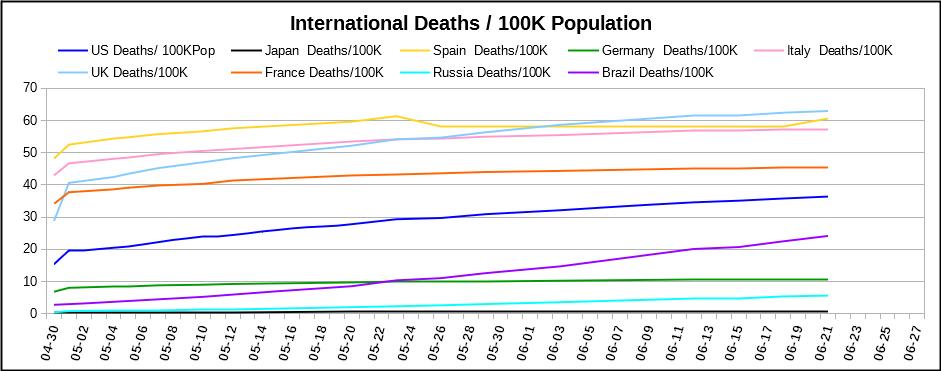 Chart8: International reported Covid-19 deaths per 100K of Population. coronavirus.jhu.edu | |
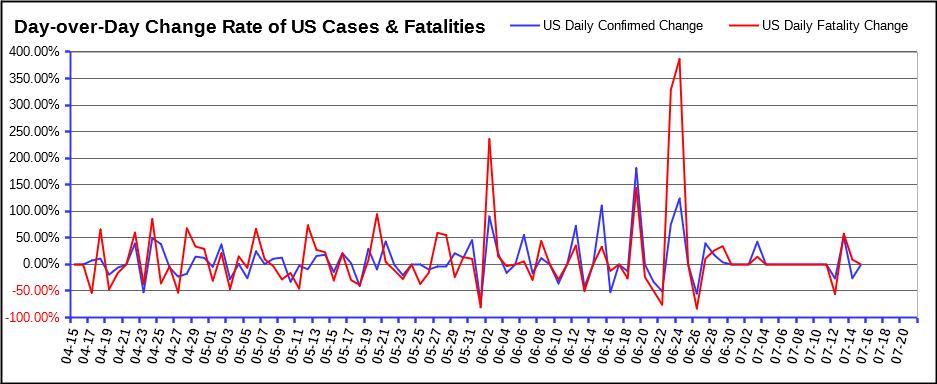 Chart9: Daily increase/decrease rate of Covid-19 Cases and Fatalities. coronavirus.jhu.edu | |
| Sponsored by: |  |